

Advanced Excel & Data Analytics

Job-ready skills in data cleaning, analysis, automation, reporting and decision support

Duration

45 Days

Recommended training duration

Format

Hybrid

Classroom + online learning

Level

Intermediate

To advanced practical skills

Modules

15

Hands-on practical modules

Advanced Skills. Practical Learning. Career-Focused Outcomes.

Book a Free Demo
Course Description

Advanced Excel & Data Analytics

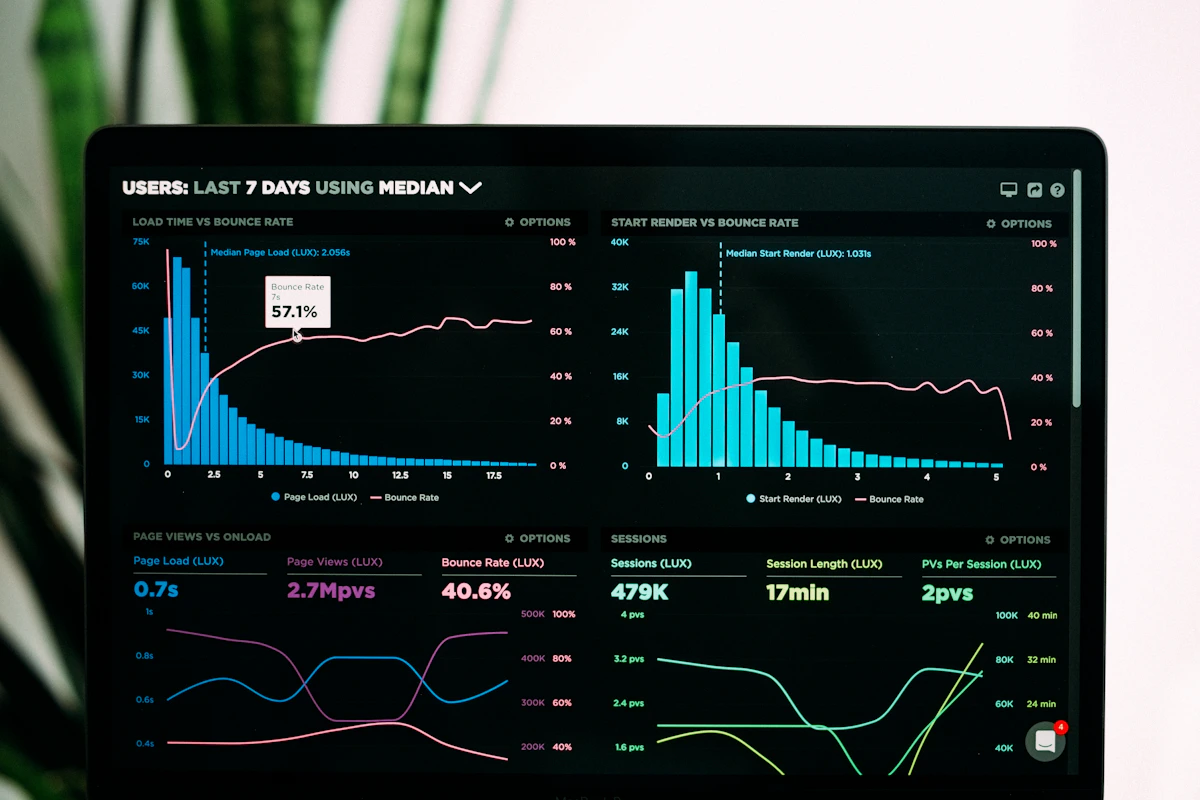
Data analytics dashboard displayed on a screen

Advanced Excel & Data Analytics is a job-ready learning program designed to help professionals gain practical skills in data cleaning, analysis, automation, reporting, and business decision support.

This course is built for learners who want to move beyond basic spreadsheet usage and become confident in handling real business data. Participants will work with advanced formulas, lookup functions, dynamic arrays, Power Query, Power Pivot, DAX, dashboards, and automation tools to solve day-to-day business challenges.

With a balanced blend of theory and hands-on practice, this program helps participants build dashboards, prepare MIS reports, automate repetitive tasks, and support management with meaningful insights. It is ideal for professionals in HR, finance, operations, sales, and reporting functions who want to improve efficiency and decision-making.

Course Highlights

  • Advanced Formula Engineering

    Nested IF, IFS, SUMIFS, COUNTIFS, array functions, and auditing.

  • Advanced Lookup & Reference

    XLOOKUP, XMATCH, INDEX-MATCH, and two-way multi-criteria lookup logic.

  • Power Query & Data Cleaning

    Import CSV files, merge datasets, unpivot data, and build clean data workflows.

  • PivotTables & PivotCharts

    Create calculated fields, slicers, timelines, and automated analysis.

  • Power Pivot & DAX

    Build data models, manage relationships, and design KPI measures.

  • Interactive Dashboards

    Design KPI cards, dynamic titles, controls, and modern management dashboards.

  • What-If & Forecasting

    Goal Seek, scenarios, data tables, forecast sheet, and break-even analysis.

  • Macros & VBA

    Record macros, automate operations, debug logic, and create user forms.

15 Practical Modules

  • 01 Advanced Formula Engineering – Build robust formulas for decision support and reporting.
  • 02 Advanced Lookup & Reference – Use XLOOKUP, XMATCH, and INDEX-MATCH to work with complex datasets.
  • 03 Text & Date Functions – Clean messy data and manage time-based formulas like EDATE and NETWORKDAYS.
  • 04 Dynamic Array Functions – Create live formulas with FILTER, SORT, UNIQUE, and SEQUENCE.
  • 05 Advanced Data Management – Structure tables, protect workbooks, and manage dependent data lists.
  • 06 PivotTables & PivotCharts – Build executive-ready summaries and interactive analytics views.
  • 07 Power Query – Import, clean, merge, and transform large data sources with repeatable processes.
  • 08 Power Pivot & Data Modelling – Create scalable models and connect multiple data sources logically.
  • 09 DAX Fundamentals – Create measures, calculate KPIs, and work with filter context using CALCULATE and SWITCH.
  • 10 Charts & Visualisation – Present insights through waterfall, funnel, Pareto, KPI cards, and trend visuals.
  • 11 Interactive Dashboards – Design compelling business dashboards with navigation and dynamic controls.
  • 12 What-If & Forecasting – Analyze scenarios, forecast outcomes, and model break-even results.
  • 13 Macros & VBA Automation – Automate repetitive tasks and build simple workflow-driven tools.
  • 14 Advanced MIS Reporting – Consolidate daily, weekly, and monthly management reports with variance analysis.
  • 15 HR & Payroll Analytics – Solve HR and payroll reporting problems using attendance, overtime, attrition, and recruitment data.

Hands-On Projects & Assessment

Build with Real Data

Apply your skills through practical projects based on common business reporting needs.

  • Attendance and leave-management system
  • Payroll and overtime workbook
  • Recruitment funnel dashboard
  • Attrition and workforce analytics
  • Sales and financial MIS dashboard
  • Power Query cleaning and automated reporting projects

Assessment & Certification

Track progress throughout the course and demonstrate your skills in a practical capstone.

30%Practical exercises and assignments
20%Module-wise assessments
20%Final practical examination
30%Capstone dashboard project

Course completion certificate awarded on successful completion.

Course Outcomes

  • Manage large business datasets accurately
  • Build dynamic lookup models & reports
  • Clean & combine data with Power Query
  • Create data models with Power Pivot & DAX
  • Design interactive management dashboards
  • Automate tasks with macros & VBA
  • Prepare HR, payroll & MIS reports

Placement Support & Career Guidance

Build your confidence for the next step in your career. Share your goals with us and our team can guide you on job-readiness, presenting your Excel and analytics skills, and relevant opportunities.

Career guidance discussion with a professional team
  • Get guidance on presenting your Excel and data analytics projects.
  • Discuss resume preparation and interview readiness.
  • Tell us about your preferred role and location.

Tell Us About Your Goals

Complete the form and our team will contact you about available support.